Average Monthly Mortgage Payment

Decoding Your Budget: What is the Average Monthly Mortgage Payment ?
For many Americans, the path to homeownership is both a dream and a complex mathematical puzzle. As we navigate 2026, the question on every potential buyer’s mind—from the first-time homebuyer to the seasoned real estate investor—is often the same: how much is the average mortgage payment in today’s market? While interest rates have eased slightly from the peaks of previous years, the combination of sustained home prices and a shifting economic landscape has redefined what constitutes a “typical” monthly bill.
Understanding these numbers is a vital part of the homebuying process. It is no longer just about the sticker price of the house; it is about the monthly cash flow. Whether you are a self employed home buyer trying to prove your income stability or a retiree looking to downsize without draining your nest egg, knowing the national and regional benchmarks can help you set realistic expectations. In this guide, we will break down the latest data to show you exactly where the market stands today.
What is the average monthly mortgage payment?
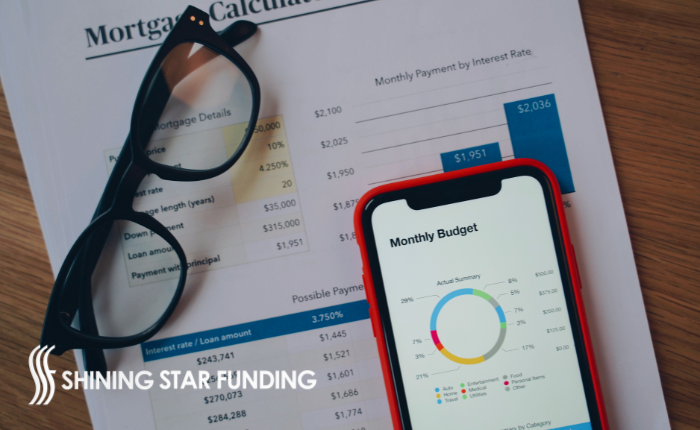
As of early 2026, the median average mortgage payment in the United States has stabilized at approximately $2,061. This figure represents a significant shift from just five years ago, reflecting a nearly 44% increase since 2021. For those currently in the homebuying process, this “sticker shock” is the result of a “higher for longer” interest rate environment paired with a low inventory of available homes that has kept prices buoyant.
However, “average” is a relative term. For asset-rich individuals seeking for real estate investments, the actual payment can vary wildly based on their down payment strategy. Those who can afford a 20% down payment are seeing monthly totals closer to $1,738 for a typical home, while those utilizing low-down-payment programs may find themselves well above the $2,000 mark once mortgage insurance is factored in.

Monthly mortgage payments by loan size
The principal amount you borrow is the single largest driver of your monthly bill. In 2026, with interest rates hovering in the low-to-mid 6% range, the difference of even $100,000 in loan size can dramatically alter your lifestyle. Below is a breakdown of estimated monthly principal and interest payments based on current 2026 rates (assuming a 30-year fixed rate at approximately 6.3%):
| Loan Amount | Estimated Monthly Payment (P&I) |
|---|---|
| $300,000 | $1,857 |
| $400,000 | $2,476 |
| $500,000 | $3,095 |
| $600,000 | $3,714 |
Monthly mortgage payments by loan type
Your choice of financing is a critical branch of the homebuying process. Different loans carry different risks and, consequently, different costs. In 2026, the average house payment can look quite different depending on the “flavor” of your mortgage:
- 30-Year Fixed: The standard choice for stability. Currently averaging around 6.38%, offering a predictable payment for the life of the loan.
- 15-Year Fixed: Favored by those who want to build equity fast. Rates are lower (around 5.8%), but the monthly payment is significantly higher due to the shorter term.
- FHA Loans: Popular for those with lower credit scores. While the interest rate might be lower (around 6.1%), the addition of mandatory Mortgage Insurance Premiums (MIP) can make the total average mortgage payment higher than a conventional loan.
- Jumbo Loans: Necessary for high-value properties. Rates currently sit slightly higher (around 6.6%) due to the increased risk and loan volume.
Mortgage payments for the top 15 metro areas
Location is the ultimate “X-factor” in real estate. While the national median is a helpful benchmark, the reality in high-demand cities is often much starker. For asset-rich individuals seeking for real estate investments in coastal hubs, the average house payment can easily double or triple the national average.
Mortgage payments in top metros (Estimated 2026):
- San Jose / San Francisco, CA: Frequently topping $4,000 – $5,800 per month.
- New York / Newark: Averaging $3,260.
- Los Angeles, CA: Roughly $3,255.
- Boston, MA: Approximately $3,005.
- Seattle, WA: Near $2,989.
- Miami, FL: Around $2,664.
- Austin, TX: Averaging $2,610.
- Chicago, IL: More affordable at $1,994.
Home prices and monthly mortgage payments over time
To understand where we are, we must look at where we’ve been. In 2021, a borrower could secure a 3% interest rate, making a $400,000 home cost roughly $1,686 per month. By late 2023, that same loan amount at 7.7% interest cost nearly $2,850.
In 2026, we are seeing a “stabilization” phase. Home prices have slowed their rapid ascent, growing at a modest 1.3% to 2.2% annually, while rates have “settled” into a new normal. This means the average mortgage payment is no longer jumping by hundreds of dollars every few months, providing some much-needed predictability for those in the homebuying process. However, the “lock-in effect” remains, as homeowners who secured 3% rates in 2020 are hesitant to trade up for a 6% rate today.
What is included in an average mortgage payment?
When you ask, “how much is the average mortgage payment,” you must look beyond the principal and interest. Lenders often use the acronym PITI to describe the total monthly obligation:
- Principal: The actual amount going toward paying down your loan balance.
- Interest: The cost of borrowing the money.
- Taxes: Property taxes collected by your local government, often held in an escrow account.
- Insurance: Homeowners insurance to protect the asset.
- PMI/MIP: Private Mortgage Insurance, required if your down payment is less than 20%.
- HOA Fees: While not always part of the mortgage check, Homeowners Association fees are a critical part of your monthly housing “burn rate.”
For a self employed home buyer, these additional costs are vital for accurate tax planning and business expense tracking. For real estate investors, they represent the “carrying costs” that must be subtracted from rental income to determine true profitability.
Conclusion: Finding Your Number
While the average mortgage payment provides a snapshot of the national mood, your individual number will be a reflection of your unique financial profile. In 2026, the market rewards those who are prepared—those who have polished their credit scores, saved for a substantial down payment, and researched their specific target neighborhoods.
Whether you are a retiree looking for a manageable fixed cost or a first-time buyer ready to start building equity, remember that homeownership is a marathon, not a sprint. By understanding the components of your payment and how they shift across different regions and loan types, you can navigate the homebuying process with the confidence of a pro. The “average” might be $2,061, but with the right strategy, your perfect payment is within reach.
FAQ's
Generally, yes, but your loan term matters too. A $400,000 loan at 6% over 30 years costs $2,398 per month. That same loan at 7% over 40 years (a specialized product for some) would cost $2,494. While the payment is similar, the 40-year loan will cost hundreds of thousands more in total interest over time.
If the average payment feels out of reach, consider these tactics:
Buy Down the Rate: Pay “discount points” upfront to lower your interest rate for the life of the loan.
Increase Your Down Payment: A larger down payment reduces the principal and can eliminate the need for PMI.
Shop Homeowners Insurance: Getting multiple quotes can sometimes save $50–$100 per month on the insurance portion of your payment.
For a complete budget in the homebuying process, you must look beyond PITI:
PMI (Private Mortgage Insurance): Required if your down payment is less than 20%.
HOA Fees: If you live in a condo or planned community, these are paid separately (often $200–$600+).
Maintenance: A good rule is to budget 1% of the home’s value annually for repairs.
Most lenders use the acronym PITI to describe your total payment:
Principal: The portion that pays down the actual loan balance.
Interest: The cost of borrowing the money from the lender.
Taxes: Property taxes held in escrow and paid to your local government.
Insurance: Homeowners insurance to protect the property (and the lender’s interest).
Historically, we are in a “rebalancing” phase. In 2021, the average 30-year fixed rate was just under 3%, resulting in a median payment of around $1,100. By 2023, rates peaked near 7.8%, pushing payments toward $2,900. Entering 2026, the market has seen the first year-over-year decline in real monthly payments since 2020, as slightly lower rates (6.1% vs 6.6% a year ago) offset modest home price growth.
In elite metros like San Francisco or Seattle, the combination of high demand and limited supply has pushed median sale prices into the seven-figure range. Even with a 20% down payment, a buyer in San Francisco may need a household income exceeding $320,000 just to manage a monthly mortgage payment that often tops $7,500.
Geography is destiny when it comes to your mortgage bill. In 2026, the discrepancy between high-cost hubs and “refuge markets” is vast:
San Jose / San Francisco, CA: $4,000+
Santa Cruz, CA: $3,457
New York City, NY: $3,260
Los Angeles, CA: $3,255
San Diego, CA: $3,243
Washington, D.C.: $3,181
Boston, MA: $3,005
Seattle, WA: $2,989
Denver, CO: $2,681
Miami, FL: $2,664
Austin, TX: $2,610
Dallas, TX: $2,491
Houston, TX: $2,433
Chicago, IL: $2,237
Philadelphia, PA: $2,199
The structure of your loan can significantly change your monthly cash flow.
30-Year Fixed: The standard for most in the homebuying process, offering the most predictable long-term payment.
15-Year Fixed: These currently average 5.50%. While the rate is lower, the monthly payment is roughly 40% higher because you are paying off the principal twice as fast.
FHA Loans: Popular for their 3.5% down payment, but they require a monthly Mortgage Insurance Premium (MIP) that adds to the total cost.
Adjustable-Rate Mortgages (ARMs): These may offer a lower “teaser” rate for the first 5 or 7 years but carry the risk of significant payment increases later.
The amount you borrow is the most direct driver of your monthly cost. In 2026, with 30-year fixed rates averaging around 6.11%, here is a breakdown of estimated monthly principal and interest:
$250,000 Mortgage: ~$1,517 per month.
$385,000 Mortgage (Current National Average): ~$2,339 per month.
$500,000 Mortgage: ~$3,033 per month.
$750,000 Mortgage: ~$4,549 per month.
As of March 2026, the median monthly mortgage payment in the United States is approximately $2,070. This figure represents the “Principal and Interest” portion for a typical home purchase. However, when you factor in property taxes and homeowners insurance (the full PITI payment), the total average commitment for most new homeowners sits closer to $2,745.
527 Sycamore Valley Rd W, Danville, CA 94526
Toll Free Call : (866) 280-0020
For informational purposes only. No guarantee of accuracy is expressed or implied. Programs shown may not include all options or pricing structures. Rates, terms, programs and underwriting policies subject to change without notice. This is not an offer to extend credit or a commitment to lend. All loans subject to underwriting approval. Some products may not be available in all states and restrictions may apply. Equal Housing Opportunity.
Interactive calculators are self-help tools. Results received from this calculator are designed for comparative and illustrative purposes only, and accuracy is not guaranteed. Shining Star Funding is not responsible for any errors, omissions, or misrepresentations. This calculator does not have the ability to pre-qualify you for any loan program or promotion. Qualification for loan programs may require additional information such as credit scores and cash reserves which is not gathered in this calculator. Information such as interest rates and pricing are subject to change at any time and without notice. Additional fees such as HOA dues are not included in calculations. All information such as interest rates, taxes, insurance, PMI payments, etc. are estimates and should be used for comparison only. Shining Star Funding does not guarantee any of the information obtained by this calculator.
Privacy Policy | Accessibility Statement | Term of Use | NMLS Consumer Access
CMG Mortgage, Inc. dba Shining Star Funding, NMLS ID# 1820 (www.nmlsconsumeraccess.org, www.cmghomeloans.com), Equal Housing Opportunity. Licensed by the Department of Financial Protection and Innovation (DFPI) under the California Residential Mortgage Lending Act No. 4150025. To verify our complete list of state licenses, please visit www.cmgfi.com/corporate/licensing